imaginima
The abrdn Total Dynamic Dividend Fund (NYSE:AOD) is an interesting closed-end fund that can assist income-focused investors in achieving their goals. Perhaps the most interesting thing about this fund is that it invests its assets into common equity securities as opposed to fixed-income assets like most income-focused funds. I explained the advantages of this approach in a few previous articles, such as this one. From that article:
As I have explained in various previous articles, equities tend to be better at protecting investors against inflation than fixed-income securities. While the inflation fears have subsided a bit since the most recent report claims that prices were flat in June, the core producer price index actually accelerated with the June year-over-year increase coming in at the highest level that it has seen in a year.
…
Thus, we are not out of the woods yet with respect to inflation, and it is still very important that investors retain their exposure to assets that will hold their purchasing power on an inflation-adjusted basis. This means that we need to be invested in equities, gold, and similar things.
The fact that the abrdn Total Dynamic Dividend Fund invests in equities means that it should do a bit better at maintaining an investor’s purchasing power than a fixed-income fund over time. The fact that this one also invests internationally should help a bit too, since inflation is by definition a weakening of a nation’s currency. In some cases, international assets can help protect against inflation if the other nation’s currency is not declining as rapidly in value.
Investors do not really have to sacrifice yield by purchasing the abrdn Total Dynamic Dividend Fund over other options. As of the time of writing, the fund yields a reasonably attractive 8.15%. Here is how that compares to the fund’s peers:
Fund Name | Morningstar Classification | Current Yield |
abrdn Total Dynamic Dividend Fund | Equity-Global Equity | 8.15% |
Allspring Global Dividend Opportunity Fund (EOD) | Equity-Global Equity | 9.20% |
Calamos Long/Short Equity & Dynamic Income Trust (CPZ) | Equity-Global Equity | 10.80% |
Eaton Vance Tax-Advantaged Global Dividend Income Fund (ETG) | Equity-Global Equity | 8.45% |
Lazard Global Total Return and Income Fund (LGI) | Equity-Global Equity | 10.92% |
Royce Global Trust (RGT) | Equity-Global Equity | 1.28% |
Admittedly, the abrdn Total Dynamic Dividend Fund currently has a yield that is a bit lower than most other closed-end funds that employ a similar strategy. This certainly might reduce the fund’s appeal among those investors for whom maximizing their income is of critical importance. However, an 8.15% current yield is still far higher than can be obtained from any equity index, and it is similar to the yields offered by some fixed-income funds today. The fund should also benefit if common stocks continue to appreciate in price, as that will increase its net asset value or potentially result in a distribution increase. Admittedly, this fund has not changed its distribution since May 2015, so that might be an optimistic statement, but frequently funds with significantly lower yields than their peers wind up increasing their distributions at some point. We will want to have a closer look at this fund’s portfolio and financial situation to determine if that is a possibility for it.
As regular readers may remember, we previously discussed the abrdn Total Dynamic Dividend Fund in early April of this year. The equity markets in both the United States and abroad have been very strong since that time, as investors have been bidding up equity prices due to interest rate cut expectations and the opportunities that they foresee from artificial intelligence. As such, we might expect that the abrdn Total Dynamic Dividend Fund has also delivered a reasonably attractive performance since the previous article was published.
This is indeed the case, as shares of this fund have risen by 3.80% since that previous article was published. This is better than the MSCI World Index (URTH) has delivered since that date, but it is admittedly not quite as good as the S&P 500 Index (SP500) has performed. We can see this here:
Seeking Alpha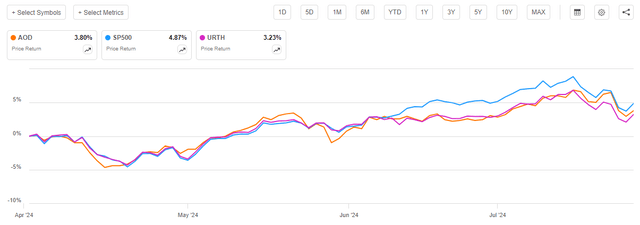
This is certainly a performance that might attract some investors. After all, the fund managed to beat the MSCI World Index, which is probably a better benchmark for a global fund than the S&P 500 Index. While the fund did not quite manage to beat domestic large-cap stocks, investors for whom income is a high priority are sometimes willing to accept a certain amount of underperformance in exchange for a higher yield. This fund probably did good enough for most investors in this category.
However, anyone who purchased the fund when my last article was published has actually done better than the above chart suggests. As I stated in my previous article on this fund:
A fund’s share price performance alone does not provide an accurate picture of how well investors in the fund have actually done. This is because closed-end funds such as the abrdn Total Dynamic Dividend Fund typically pay out most or all of their investment profits to the shareholders in the form of distributions. The basic business model is to keep the fund’s portfolio at a relatively stable level and give the investors distributions totaling all of the profits earned from the assets. These distributions will not be reflected in the fund’s share price performance, but they obviously represent a real return that is realized by the shareholders.
We should, therefore, include the distributions that the fund paid out when analyzing its performance during a given period. When we do this, we get the following alternative chart:
Seeking Alpha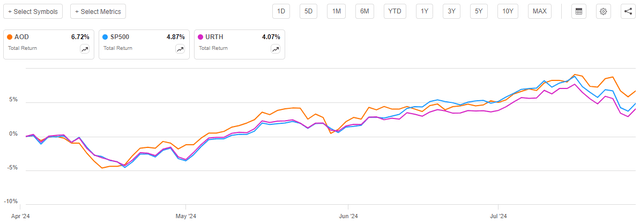
This is very nice to see overall. As we can see, investors who purchased the abrdn Total Dynamic Dividend Fund on the date that my previous article was published have managed to beat both the MSCI World Index and the S&P 500 Index on a total return basis. Thus, in this case, it does not appear that we have needed to sacrifice return in order to obtain a high level of income. Any investor should be reasonably satisfied here.
As already stated, my last article on this fund was published in early April, so roughly four months have passed since that time. A lot can happen in four months, and this fund has naturally made some changes that we should discuss. The most important of these changes is that the fund released an updated financial report that covers the six-month period that ended on April 30, 2024, so we will want to pay special attention to it. After all, this report will give us a better understanding of how well the fund’s portfolio is performing and how well it is covering its distribution than we had previously.
About The Fund
According to the fund’s website, the abrdn Total Dynamic Dividend Fund has the primary objective of providing its investors with a high level of current income from dividend-paying assets. The fund’s website does not go into much detail about how exactly it seeks to achieve this objective, other than mentioning dividend-paying stocks:
abrdn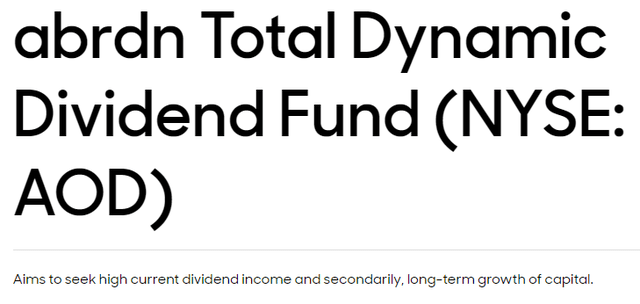
This screenshot is quite literally all that the website states about the fund’s strategy. This is a strange objective for any closed-end fund due to the simple fact that it is very hard to achieve any reasonable level of income from dividends paid by any common equity. For example, consider the yield of the following indices:
Index/Index ETF | TTM Yield |
SPDR S&P 500 ETF Trust (SPY) | 1.26% |
iShares MSCI World ETF | 1.54% |
iShares MSCI ACWI ETF (ACWI) | 1.68% |
2.79% |
We can immediately see that not one of these indices offers a yield that is going to be attractive to income-seeking investors. There are a few country-specific indices (such as Singapore) that offer reasonably attractive yields, but the abrdn Total Dynamic Dividend Fund is not a country-specific fund. Thus, we cannot expect that it will just invest in a single nation to achieve the goal of earning a high level of income from dividends.
The fund’s fact sheet and semi-annual report do not provide any insight into the specific strategy that the fund uses in order to achieve its objectives. Thus, all we really know is that the fund invests in dividend-paying securities. The semi-annual report makes it quite clear that these securities consist primarily of common stocks. It provides the following asset allocation:
Security Type | % of Net Assets |
Common Stocks | 102.7% |
Preferred Stocks | 1.4% |
Money Market Fund | 0.6% |
Thus, we are back to my previous statement that it is very difficult to get a reasonable level of income by investing in common stocks. This is particularly true when we consider the current yields of the largest positions in the fund’s portfolio. Here are the largest positions in the fund as of June 30, 2024:
Fund Fact Sheet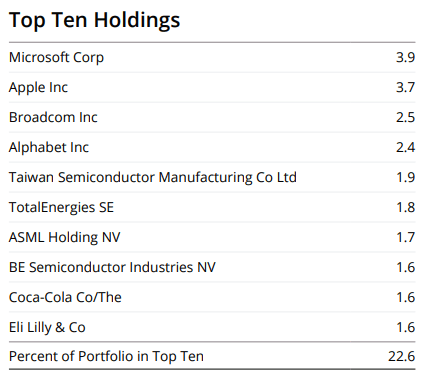
Here are the yields of these common stocks:
Company Name | Current Yield |
Microsoft (MSFT) | 0.71% |
Apple (AAPL) | 0.46% |
Broadcom (AVGO) | 1.38% |
Alphabet (GOOGL) | 0.12% |
Taiwan Semiconductor Manufacturing (TSM) | 1.26% |
TotalEnergies SE (TTE) | 4.77% |
ASML Holding (ASML) | 0.75% |
BE Semiconductor Industries N.V. (OTC:BESIY) | 1.69% |
The Coca-Cola Company (KO) | 2.89% |
Eli Lilly and Company (LLY) | 0.65% |
As we can clearly see, many of the companies that currently comprise the fund’s largest holdings do not have yields that are significantly above those of the indices. Indeed, only three companies on this list currently beat the MSCI World Index in terms of yield. This further makes me question the fund’s objectives, as we would expect that any fund that is aiming to receive a high level of dividend income would invest in common stocks that actually have yields that are better than the various indices.
The fund’s portfolio makes a lot of sense if it is actually pursuing a total return objective, as several of these stocks have historically delivered fairly attractive returns when capital gains and dividends are combined. However, the fund is only listing the long-term growth of capital as a secondary objective and not as a primary objective alongside income. This makes no sense given its current portfolio.
There have been three significant changes to the largest positions in the fund since our previous discussion. These are that Enbridge (ENB), Linde (LIN), and AbbVie (ABBV) have been removed from their former positions among the fund’s largest holdings. In their place, we have Taiwan Semiconductor Manufacturing, Coca-Cola, and Eli Lilly. The interesting thing here is that the removed companies actually have higher yields than the new additions. We can see this here:
Removed Company | Current Yield |
Enbridge | 7.25% |
1.23% | |
AbbVie | 3.35% |
Compare this to the chart above showing the yields of the newly added companies. We can immediately see that only Linde has a yield that is in the same general vicinity as the newly added companies. Enbridge and AbbVie both have yields that are substantially higher. This further casts doubt on the fund’s focus on dividend income as opposed to total return.
That is not to say that the changes did not have merit from an investment perspective. All three of the newly added companies have outperformed Enbridge by quite a lot over the period:
Seeking Alpha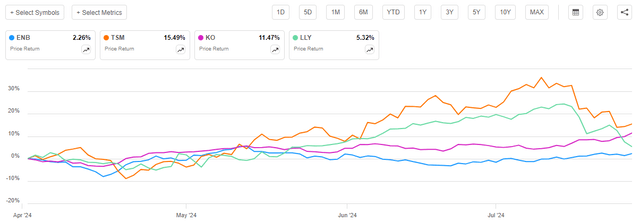
Linde’s stock price has actually declined since our previous discussion. AbbVie’s stock price only appreciated by 2.47%, so it has also underperformed all of the new additions. Thus, the new additions (Taiwan Semiconductor Manufacturing and Coca-Cola especially) have undoubtedly delivered investors a much better total return than the previous top ten positions list would have delivered. However, the fund did have to sacrifice some dividend income to achieve this performance.
Personally, if I were a shareholder, I would be fine with this change as I would rather have a higher total return than a higher dividend income. My criticisms are only leveled at the fact that this fund claims to be pursuing dividend income above capital gains, but its portfolio changes over time and general positioning suggests that this is not the case.
The abrdn Total Dynamic Dividend Fund shares the same global characteristics of most abrdn funds. This one invests its assets in securities from all over the world. The semi-annual report lists the following country allocation as of April 30, 2024:
Country | % of Net Assets |
Australia | 0.8% |
Brazil | 1.6% |
Canada | 1.5% |
China | 1.7% |
Denmark | 1.2% |
France | 10.8% |
Germany | 3.2% |
Hong Kong | 0.9% |
Japan | 1.8% |
Netherlands | 4.1% |
Norway | 1.8% |
Singapore | 1.4% |
South Korea | 0.8% |
Spain | 1.7% |
Sweden | 0.7% |
Taiwan | 1.7% |
United Kingdom | 4.3% |
United States | 62.7% |
We do see a very marked focus on both developed markets in general and the United States in particular. Indeed, the only nations listed here that are not developed nations are Brazil, China, Hong Kong, and Taiwan. Many emerging market funds also include Israel and South Korea as emerging nations, but neither one of them really qualifies as a developing nation, as both of them have economies that are easily on par with most of Europe. As such, investors who are seeking emerging market exposure should look elsewhere.
The fund’s heavy weighting towards the United States is perhaps a bigger problem for American investors. If the comments that I regularly see on some of my articles on this site are any indication, many American investors are interested in reducing their exposure to their home country. This is at least partially due to the fiscal problems of the Federal government and the growing global aversion towards the U.S. dollar, which I have discussed in a number of previous articles. It could also be due to the fact that the United States has outperformed most foreign markets over the past fifteen years, which has resulted in most domestic investors having a substantial proportion of their wealth tied up in their home country. That could be a dangerous situation as it basically means that this individual could be devastated by any problems in the United States, but they might be able to reduce the extent of this devastation by spreading their assets all over the world. The abrdn Total Dynamic Dividend Fund has 62.7% of its net assets invested in the United States, so it is perhaps not the best option to use to achieve this desired international diversification.
With that said, the MSCI World Index actually has a much higher weighting to the United States than this fund does:
BlackRock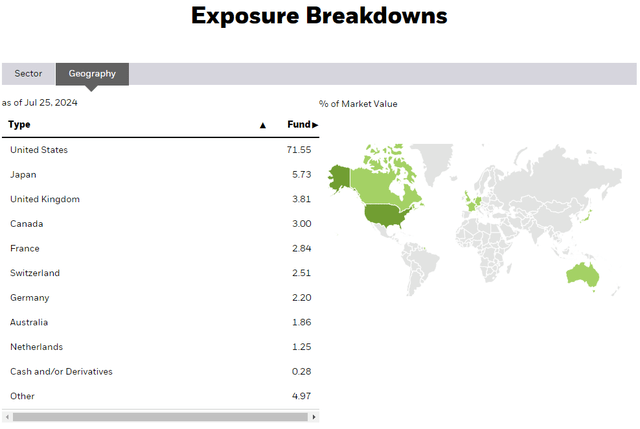
As we can see, 71.55% of the MSCI World Index consists of companies that are based in the United States. Thus, the abrdn Total Dynamic Dividend Fund has lower exposure to the United States than the index as a whole, which is certainly a good thing. However, investors who are seeking to achieve true international diversification should probably look at an international or ex-U.S. fund instead.
It is also worth noting that this fund appears to be heading in the wrong direction for those investors who are seeking to reduce their domestic exposure. Here are the fund’s country weightings as of June 30, 2024, per the fact sheet:
Fund Fact Sheet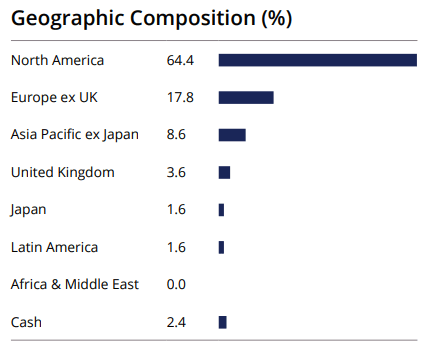
As we can see, the fund reported a 64.4% of total assets exposure to North America as of June 30, 2024. If we assume that this exposure consists solely of the United States and Canada, as seems likely, then it has increased its exposure to at least one of these countries during either May or June of this year. As of April 30, 2024, as noted above, the fund had 64.2% of its assets invested in the United States and Canada. This has increased to 64.4% as of June 30, 2024. While it is possible that all of this increase came from the fund increasing its Canadian exposure, that seems unlikely. The only Canadian position that the fund had on April 30, 2024, was Enbridge, and that company has since fallen out of the fund’s largest positions. Therefore, the most logical conclusion here is that the fund increased its exposure to American securities over the past two months. This is not what we want to see if we are hoping to reduce our American exposure.
Leverage
As is the case with most closed-end funds, the abrdn Total Dynamic Dividend Fund employs leverage as a method of boosting the effective income and capital gains that it earns from the securities in its portfolio. I explained how this works in my previous article on this fund:
In short, the fund is borrowing money and using that borrowed money to purchase dividend-paying common equities of various companies from around the world. As long as the purchased assets deliver a higher total return than the interest rate that the fund has to pay on the borrowed money, the strategy works pretty well to boost the effective yield of the portfolio. As this fund is capable of borrowing money at institutional rates, which are considerably lower than retail rates, this will usually be the case. However, it is important to note that this strategy is not as effective today with interest rates at 6% as it was two years ago when rates were at 0%.
However, the use of debt in this fashion is a double-edged sword. This is because leverage boosts both gains and losses. Thus, we want to ensure that the fund is not using too much leverage since that would expose us to too much risk. I generally do not like to see a fund’s leverage exceed a third as a percentage of assets for that reason.
In the previous article, we saw that the abrdn Total Dynamic Dividend Fund does not employ much leverage in the pursuit of its strategy. As of the time of writing, the fund boasts a 2.64% leverage ratio. This represents a substantial increase over the 1.44% leverage that the fund had the last time that we discussed it, but it is still much lower than its peers. This can be seen clearly here:
Fund Name | Leverage Ratio |
abrdn Total Dynamic Dividend Fund | 2.64% |
Allspring Global Dividend Opportunity Fund | 17.10% |
Calamos Long/Short Equity & Dynamic Income Trust | 26.04% |
Eaton Vance Tax-Advantaged Global Dividend Income Fund | 19.74% |
Lazard Global Total Return and Income Fund | 30.77% |
Royce Global Trust | 5.08% |
(all figures from CEF Data)
Immediately, we can see that the fund does not appear to be using too much leverage. After all, it is far below the one-third of assets level that we would ordinarily consider to be acceptable for an equity fund. Its current level of leverage is also far below what many of its peers employ, which suggests that it is not overleveraged.
With that said, it is rather surprising that the fund’s leverage actually increased since our early April discussion. After all, the fund’s share price has risen, which should result in a declining leverage ratio and not the other way around. The fact that the fund’s leverage ratio increased since our last discussion is even more surprising when we consider that its net asset value has also increased:
Barchart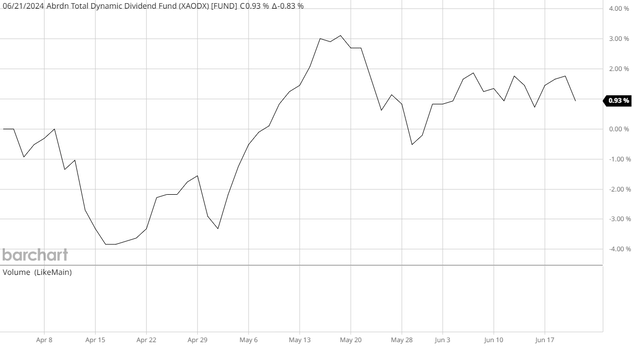
Granted, the fund’s net asset value has only increased by 0.93% over the period, which is significantly less than the fund’s share price appreciation. However, the fact remains that the fund’s net asset value did increase. Thus, the only logical conclusion here is that the fund borrowed some more money to boost its returns in the recent stock market rally. This is not necessarily a problem since its leverage is still remarkably low compared to most other closed-end funds, but it is something that we should probably just keep in the back of our minds.
Distribution Analysis
As mentioned earlier, the primary objective of the abrdn Total Dynamic Dividend Fund is to provide its investors with a very high level of dividend income. However, its portfolio appears to be more structured around delivering a combination of capital gains and dividend income. For its part, the fund provides an income to its shareholders by paying out a monthly distribution of $0.0575 per share ($0.69 per share annually). This gives it an 8.15% yield at the current share price.
The fund has historically not been especially consistent with respect to its distribution. However, it has been pretty good for the past decade or so:
CEF Connect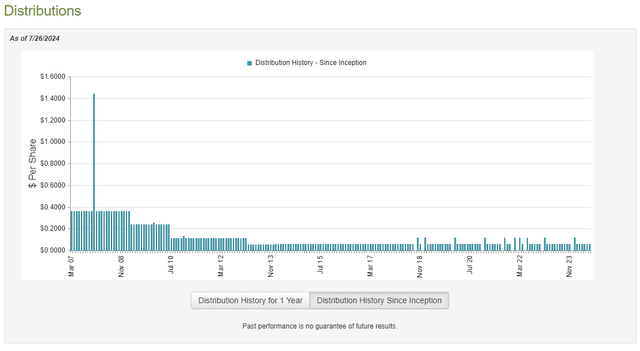
As I stated in my previous article on this fund:
We can see a number of distribution cuts over the 2007 to 2013 period. However, since then the fund has been very consistent with respect to its distribution. In early 2014, the fund started paying a monthly distribution of $0.0565 per share and it has not cut since that time. That was more than ten years ago, so we can probably excuse the cuts prior to that time. Abrdn took over the management of this fund in 2018 so everything that the fund did prior to that date is attributable to the previous management, which employed a different strategy.
The fund has been remarkably consistent since abrdn took over its management and the distribution history should overall be pretty attractive to anyone who is seeking to earn a safe and consistent level of income that can be used to pay their bills or finance their lifestyles.
The fund’s recent distribution history is quite consistent with its managed distribution policy, which is explained in the fund’s semi-annual report:
The Funds’ policy is to provide investors with a stable monthly distribution out of current income, supplemented by realized capital gains and, to the extent necessary, paid-in capital, which is a nontaxable return of capital. This policy is subject to an annual review at the quarterly meetings of each Fund’s Board of Trustees unless market conditions require an earlier evaluation.
Thus, investors who seek a consistent level of income should probably be reasonably happy with this fund. That is, after all, exactly what it aims to provide. However, we still need to make sure that the fund is not distributing more than it actually earns. We do not want it to be constantly destroying its net asset value, after all.
Fortunately, we have a pretty recent report that we can consult for our analysis. As of today, the fund’s most recent financial report corresponds to the six-month period that ended on April 30, 2024. A link to this article was provided earlier in this article. This is a newer report than the one that we had available to us at the time of our last discussion, so it should work pretty well to provide an update.
For the six-month period that ended on April 30, 2024, the abrdn Total Dynamic Dividend Fund received $36,959,776 in dividends from the assets in its portfolio. From this total, we subtract the amount that the fund had to pay in foreign withholding taxes, which gives it a total investment income of $33,719,389 for the six-month period. The fund paid its expenses out of this amount, which left it with $27,104,104,114 available for shareholders. That was not sufficient to cover the $36,373,695 that the fund paid out in distributions during the period, which is unfortunate.
However, the fund was able to make up for the difference through capital gains. For the six-month period, the abrdn Total Dynamic Dividend Fund reported net realized losses of $18,117,011 but it was able to more than offset this with $113,635,108 in net unrealized gains. Overall, the fund’s net asset value increased by $86,248,516 over the period.
Thus, it appears that this fund managed to fully cover the distributions that it paid out during the period. It did, however, have to rely upon its unrealized capital gains to do so. While this can be problematic since these gains could be erased by a market correction, the equity markets have remained fairly strong since the end of April, so this has not been the case so far. For the most part, the distribution is probably pretty safe, but as always, we should continue to watch its net asset value for any signs of sustained weakness.
Valuation
Shares of the abrdn Total Dynamic Dividend Fund are currently trading at a 12.32% discount to net asset value. This is only slightly worse than the 13.12% discount that the shares have had on average over the past month. As such, the current price appears to be pretty reasonable.
Conclusion
In conclusion, the abrdn Total Dynamic Dividend Fund is a global closed-end fund that does a reasonable job at providing its investors with an attractive yield. The fund is fairly unique among common equity funds in that it does not use much leverage in pursuit of its goals, which might appeal to those investors who are somewhat risk-averse and do not want to expose themselves to a high degree of volatility. The real problem with it though is that it has a very substantial amount of exposure to the United States, so it is not as good at reducing an investor’s exposure to this nation as might be expected. The fund is a bit better than the MSCI World Index in this respect, though.
The fund’s distribution is fully covered, and it trades at a fairly attractive valuation, so it is not really a bad choice for a portfolio today as long as there are other things in your portfolio to improve its general diversification.
Editor's Note: This article discusses one or more securities that do not trade on a major U.S. exchange. Please be aware of the risks associated with these stocks.
source:seekingalpha