The Nasdaq was become synonymous with the tech sector, although that comparison isn't entirely fair. About half of the index is dedicated to technology stocks, but with more than 80% of the Nasdaq Composite composed of the big three growth sectors - tech, consumer discretionary and communication services - it's safe to say that this is one to consider if you're a risk seeker.
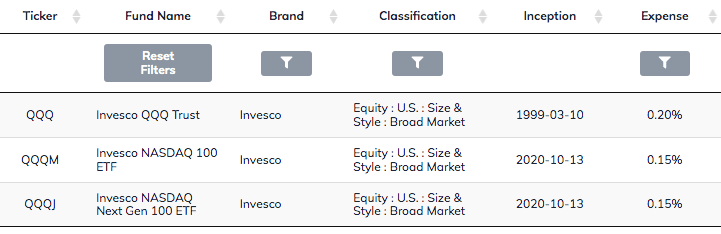
If you're looking to add Nasdaq exposure to your portfolio, there are three primary ETFs that you should consider - the Invesco QQQ ETF (QQQ), the Invesco Nasdaq 100 ETF (QQQM) and the Invesco Nasdaq Next Gen 100 ETF (QQQJ).
QQQ is the big one that everybody is familiar with. It's currently the 5th largest ETF in the marketplace with more than $150 billion in assets and is the largest that isn't focused on the S&P 500 or total U.S. stock market.
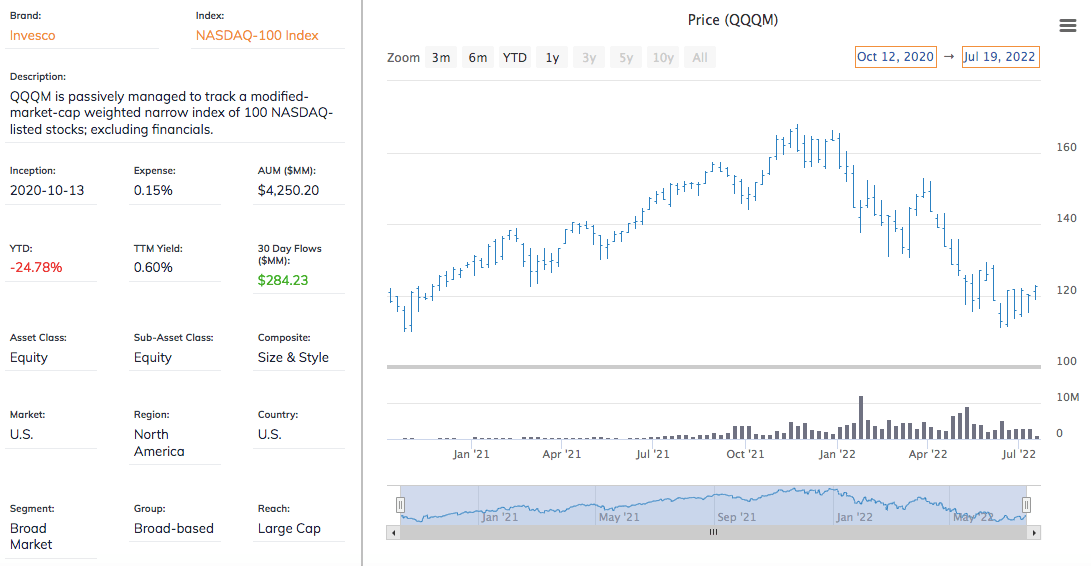
QQQM is essentially the same as the QQQ, but with a lower expense ratio. Why would you choose one over the other if they're both the same? We'll get to that in a minute.
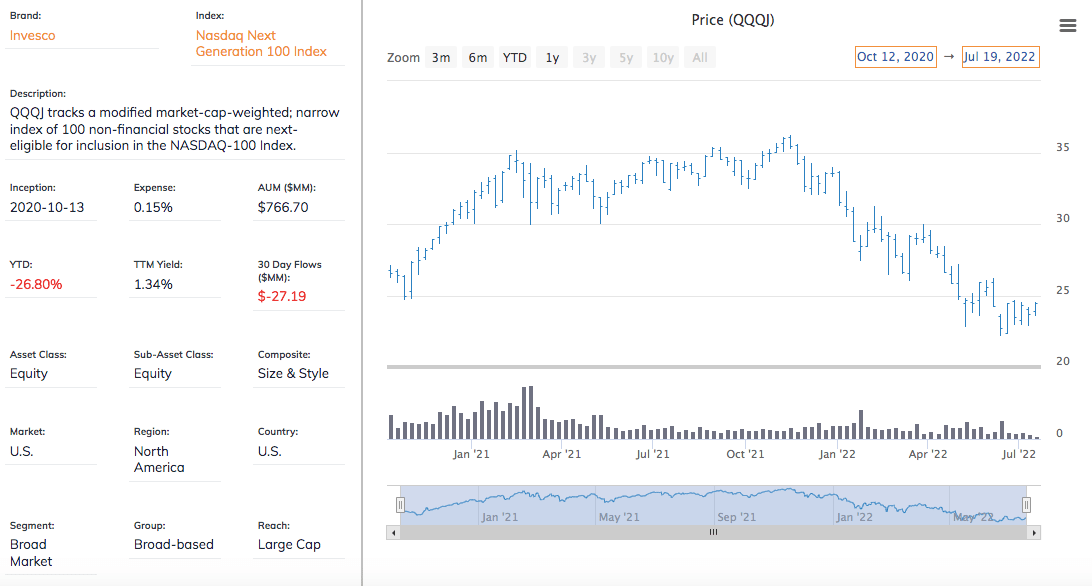
QQQJ targets the next 100 names below the Nasdaq 100, which QQQ and QQQM are based on. They offer exposure a little different than the others, but have bigger growth potential.
How should an investor decide between QQQ, QQQM and QQQJ? Let's break down each of them one by one.
Invesco QQQ ETF (QQQ)
QQQ tracks the Nasdaq 100 index. It's been around for more than 20 years and consists of 100 of the largest non-financial companies listed on the Nasdaq exchange.
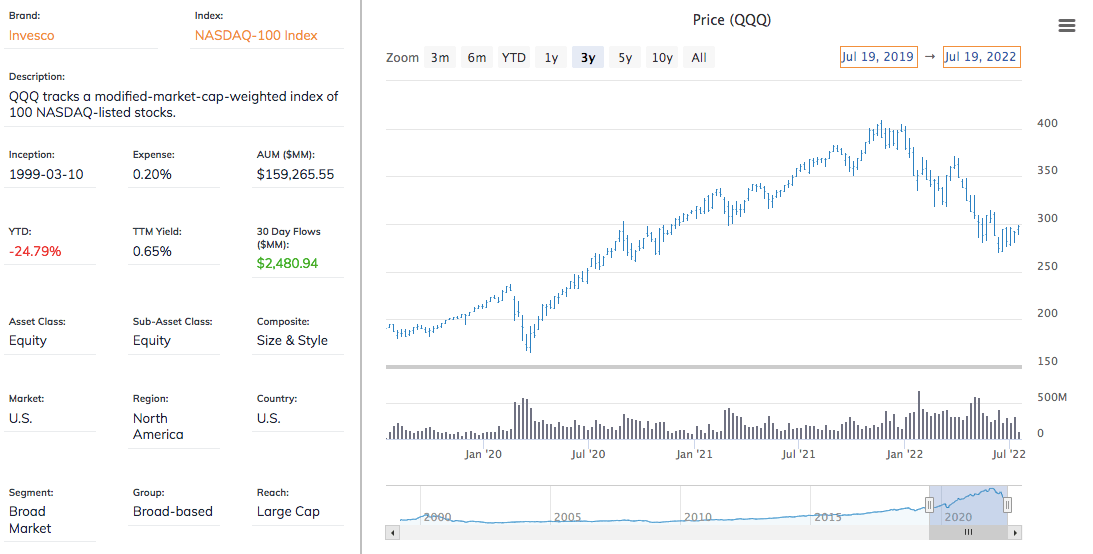
I won't spend any more time talking about the tech-heavy nature of QQQ because most are familiar with it already, but the one thing worth noting for the purpose of this comparison is its expense ratio. At 0.20%, it's relatively inexpensive, but not nearly as cheap as many of the broad market ETFs from the likes of Vanguard and BlackRock, which often have expense ratios of 0.05% or less.
Keep that in mind as we take a look at the next ETF on the list.
Invesco Nasdaq 100 ETF (QQQM)
QQQM also tracks the Nasdaq 100 index.
If you just did a double-take reading that last sentence, yes, you're reading it correctly. Invesco operates TWO ETFs that both track the Nasdaq 100. There's no gimmicks, no frills, no hidden fine print. Just two Nasdaq 100 ETFs.
So, what's the difference between QQQ and QQQM exactly? The answer is the expense ratio. QQQ charges 0.20% and QQQM charges 0.15%.
You may be asking yourself: if Invesco wanted to charge 0.15% for an ETF that tracks the Nasdaq 100, why didn't it just lower the expense ratio on QQQ? It's a good question and the answer, quite simply, is money. Just 0.05%, the difference between the two expense ratios, on a $150 billion asset base is about $75 million in revenue annually. Invesco may not come right out and say it, but why in the world would they give up that kind of revenue when it's already the 5th largest ETF around even with the higher expense ratio?
Launching QQQM with a lower expense ratio gives investors the opportunity to achieve the same exposure with a lower cost.
If QQQM is available for cheaper than QQQ, does that make QQQ irrelevant? Not exactly.
The answer to the question of which ETF you should choose comes down to a couple of things. First, while the expense ratio of QQQM is lower, you have to consider the total cost of ownership. By that, I mean you have to look at the expense ratio as well as the spread. The spread is essentially a measure of liquidity and is the cost of trading shares. Generally speaking, the larger a fund is and the more people it has trading shares, the lower the spread.
QQQM has more than $4 billion in assets, which represents strong and consistent growth of assets over time, but QQQ has more than $150 billion. Not surprisingly, its trading costs are lower, but only by a hair.
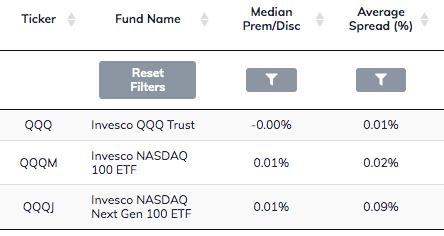
The "average spread" column is the one we want to look at. The spread on QQQ is virtually nothing because it's so large. QQQM's spread, while larger, is still just 2 basis points. It's not nothing, but it's still a very small number. When tallied together, the total cost of ownership for QQQM is 0.17% (the 0.15% expense ratio plus the 0.02% spread) vs. 0.21% for QQQ.
From a total cost of ownership perspective, QQQM edges out QQQ.
That doesn't mean QQQ can't still be useful. If you're trading a very large block of shares, the liquidity of QQQ could make it the better choice, but you'd be talking a huge block of shares. For most retail investors, it will be a non-issue. If you're a long-term buy-and-hold investor, QQQM holds a slight advantage over QQQ.
QQQJ, however, is a whole different story.
Invesco Nasdaq Next Gen 100 ETF (QQQJ)
QQQJ tracks the Nasdaq Next Generation 100 index. It also eliminates financial stocks from consideration and targets the next 100 companies that would potentially be eligible for inclusion in the Nasdaq 100 if they manage to grow large enough.
The idea behind buying QQQJ would involve the same logic for why you'd be buying small-caps. You want to get ahead of the curve by buying them before they become large-caps.
History shows that about 1/3 of Next Gen 100 members do indeed go on to become eventual members of the Nasdaq 100. These components have historically delivered higher revenue growth, higher dividend growth rates and greater commitments to R&D spending that those of the Nasdaq 100, according to Invesco research.
Obviously, there's no overlap between QQQ and QQQJ, but investors should know that they're getting substantially similar sector exposure (with one notable exception, which I'll get into in a moment). Because QQQJ is less than 2 years old, we don't have a lot of history to go off of, but shorter-term volatility measures suggest that the fund is about 20% more volatile than QQQ.
QQQ vs. QQQJ Asset Allocation
Both ETFs come in with a heavy tech and growth tilt, but QQQJ finds a lot of bubbling under stocks in the healthcare sector.
As mentioned earlier, there is very little in the Nasdaq 100 that falls outside of one of the big three growth sectors.
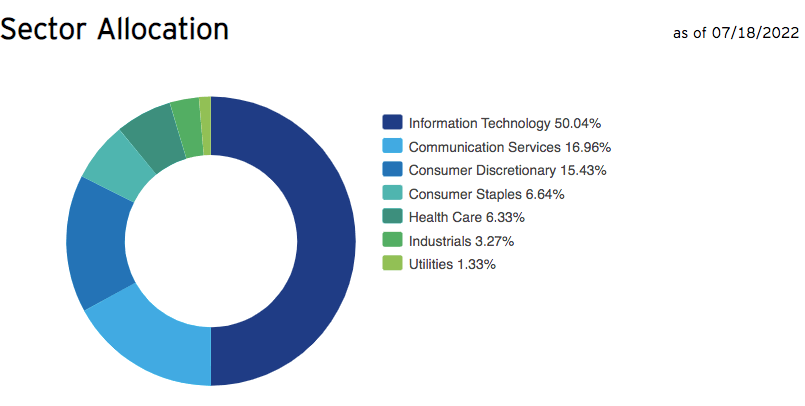
Those three sectors are well-represented in QQQJ as well, but it triples the exposure of healthcare to roughly 20% of the fund's overall allocation compared to just over 6% in QQQ.
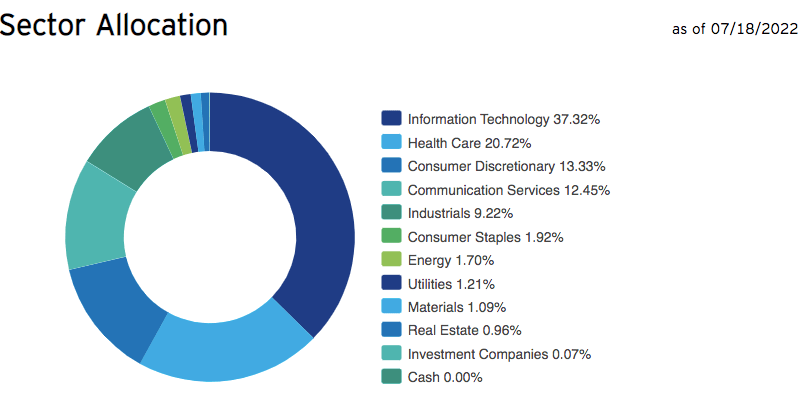
Outside of an 9% weighting to industrials, there's virtually nothing outside of the top 5 sectors. The success of QQQJ will be heavily dependent on growth stocks continuing to perform well, but the sizable allocation to healthcare gives it a bit of a different profile.
Conclusion
So, what are our investment choices overall?
QQQJ is obviously a different product than the other two, so we can consider that separately. It's more of a classic mid-cap growth ETF with a heavy tech tilt, so this would be appropriate for anyone looking to augment existing tech exposure in their portfolios or someone looking to add a punch of growth to more conservative portfolio. The success of the Next Gen 100 stocks has been proven over time and it's a nice way to be invested in the emerging up-and-comers.
QQQ vs. QQQM is a little more nuanced and the choice of which is better really depends on what you're going to use it for.
If you're a short-term trader and someone looking for a lot of liquidity in the market, QQQ is probably the better choice. If you're going to be in and out relatively quickly, it's better to go with the ETF with virtually no trading costs instead of taking a chance that you get hit with a higher spread.
Longer-term investors would probably benefit from QQQM. The difference between 0.20% and 0.15% is pretty small and we won't be talking a big difference in performance even over the long-term, but why not take advantage of the lower fee if you can get it.
Overall, these are three solid ETFs that are all worthy of consideration for your portfolio.
source:thestreet.